Revive.
senior CAPSTONE PROJECT. UX/UI. 2019.
Revive is designed to help new residents of New York City measure, track, and improve both the quantity and quality of their green time in the city. Their progress is embodied in a digital plant that grows based on the user’s efforts. The plant’s growth is calculated based on metrics tracked, such as visiting a new green place, step count, sunlight, and more. Additionally, Revive provides new places for the user to visit based on the season and weather. Users can add friends, see their place on the leaderboard, and nudge friends when their plants are dying.
Revive inspires and motivates NYC residents to seek out green space and to connect with nature more meaningfully which in turn, will benefit their health and general well-being.

Demo Video
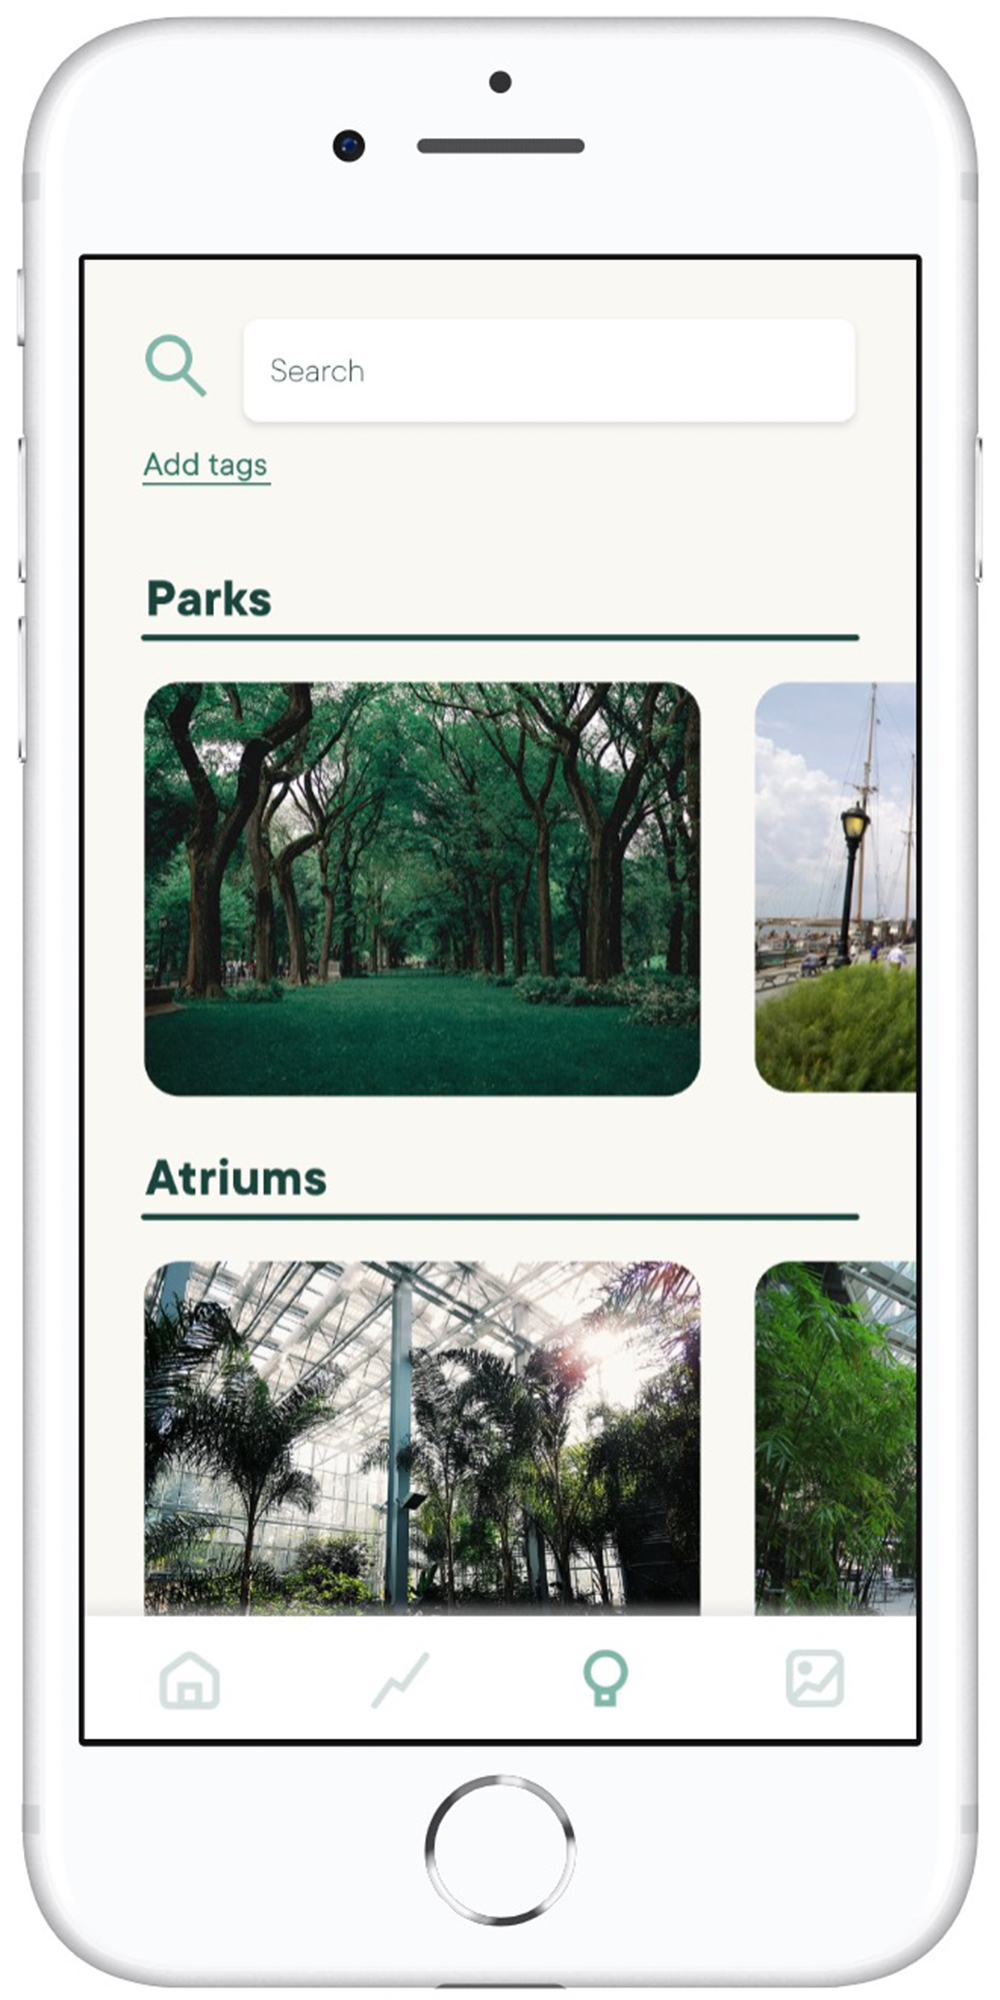
Home

Statistics

Explore

Top Gardens / Leaderboard

The Process

At the beginning of Thesis 2, the goal of my project was to help people strengthen their relationship to nature. Above is a spread from my research Compendium that details our shrinking interaction with nature.
I wanted to use New York City as a case study and a starting point, and created a map of all the green spaces in the area to better understand the proportion of green to gray. Though there are green spaces, they aren’t always easily accessible, especially during the off-seasons.

initial sketches
Initially, I had started the project with the intent of creating an app that would turn interacting with nature into a metric. I imagined that the users would set their own nature goals, and then use the app to track and visualize their progress. The mockups above were a quick sketch of the idea, and though they are pragmatic, they aren’t very motivational or rewarding.
Then, during a round of critiquing, I proposed the next iteration:
Having the user’s progress embodied in their own digital plants.


Second Iteration
This was my first attempt of the final screens. Eventually, it was ruled that the gallery page didn’t make much sense, so it was then turned into a leaderboard page in the final iteration. I also wanted to visualize the user’s data better; see the sketches below.